
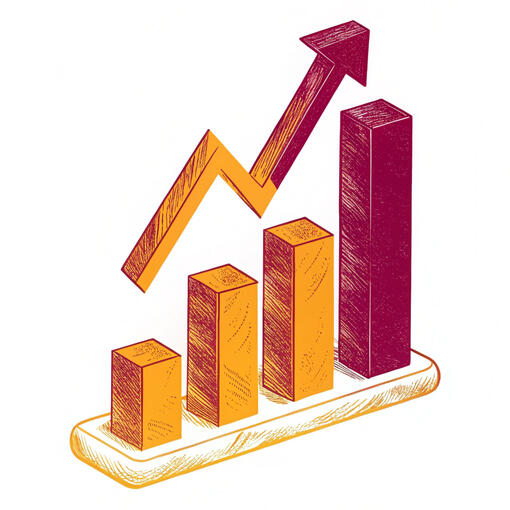
We turn your social impact data into faster growth.
For mission-driven teams, messy data stalls growth. Impact Viz transforms your raw data into interactive dashboards and team alignment — helping you make data-driven decisions and grow faster.
Data expectations have evolved.
For social impact organizations, numbers alone aren't enough — your team and stakeholders need data they can trust, explore, and use to make decisions.

Reports
Pre-2000 →

PDF's
2000–2010 →
Static Dashboards
2010–2020 →

Interactive Data
2020-Today

Spreadsheet Spaghetti is holding your team back.
You shouldn't need Ctrl+F to find your impact.
If you're still stuck in =VLOOKUP(HELL), unlock your growth with clean and interactive data.
Imagine a world where your data unites your team, informs decisions, and accelerates growth.

Chaos → Clarity
You've turned messy data into a clear, trusted source of insight.

Reporting → Storytelling
Boring reports have evolved into stories your team rallies behind.

Guesses → Data-Driven Decisions
You replaced guesswork with confident, data-backed decisions for growth.

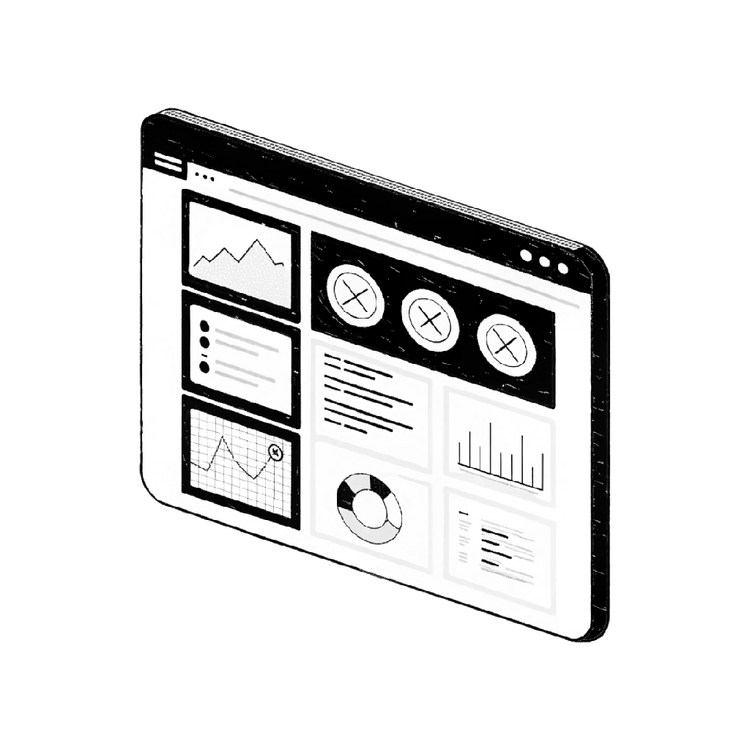
Interactive Dashboards
We create interactive dashboards that become your single source of truth for growth and more.• We'll clean and validate your data
• Iterate with any feedback consistently
• Deliver clear and actionable dashboards

Team Alignment
Get custom, presentation-ready decks designed to align your team and impress leadership. Helping you:• Build a Data-Driven team culture
• Protect your data with cybersecurity best practices
• Use data to tell stories that inspire action


"We attribute our recent explosion of growth to working with Impact Viz. They helped empower our entire team to see what really matters."— Ramzi Khouri
Crossroads, Growth Engineer
Read Case Study

Our "Spaghetti-Free-Guarantee"
After just 30 days, if you and your team aren't saying: “This is easily twice as good as before.”
Then, you do not pay.We’re proud to build relationships that have zero-risk for social impact companies like yours.


How it works (and how quickly):
We’ve helped other social impact companies start growing in just 30 days, and we’ll do the same for you — with little time or effort on your end.
Today
Book a Consultation call
• No costs, no pressure — let's just get you clarity.
Day 1
On the call, we'll game-plan your growth
• You’ll meet our Success Manager (who's previously raised $20M+ and scaled up to 50 data-driven employees) and our Senior Data Analyst.
• Together, we’ll discuss your challenges and collaborate on a proposal.
Day 7
Build a foundation for success
• Review the approach and direction of our Senior Data Analyst’s work.
• We’ll equip you with tailored, presentation-ready decks you can use to align your team and impress leadership. Learn more.
Day 30
Start growing faster
• We'll walk you and your team through your new Interactive Dashboards and that enable data-driven decisions for growth.

We only accept up to 3 teams per month
We only accept up to 3 teams per month in order to deliver on our "Spaghetti-Free-Guarantee". It’s first come, first serve — so book now or join the waitlist. Thanks for understanding our commitment to you.

We turn your social impact data into faster growth.
© Impact Viz. All rights reserved.
Growth takes more than just dashboards. It takes alignment.That’s why we don’t stop at visualizations — we deliver ready-to-use presentations designed to align your team and impress your leadership.You’ll get tailored-for-you presentations like:1. "From Goals to Growth: Becoming a Truly Data-Driven Team"
2. "Protect Your Data: Simple Cybersecurity for Smart Teams"
3. "Turn Your Data Into a Story that People Remember"We'll identify key needs of you and your company, and craft what you need to succeed.

Crossroads Case Study
From Test Data to Real-Time Insight
Crossroads is a community-driven app designed to help nomads stay connected, meet up, and build lasting friendships while on the road. Developed by and for people living a mobile lifestyle, the app launched with a mission to create intentional community in a context where connection can be fleeting.
The Challenge
In the lead-up to launch, the Crossroads team needed a way to monitor growth and usage from day one – but with a tight budget, they couldn’t afford expensive data platforms. They had a MongoDB database with their test users but no way to turn that raw data into something useful or actionable for launch day.
The Solution
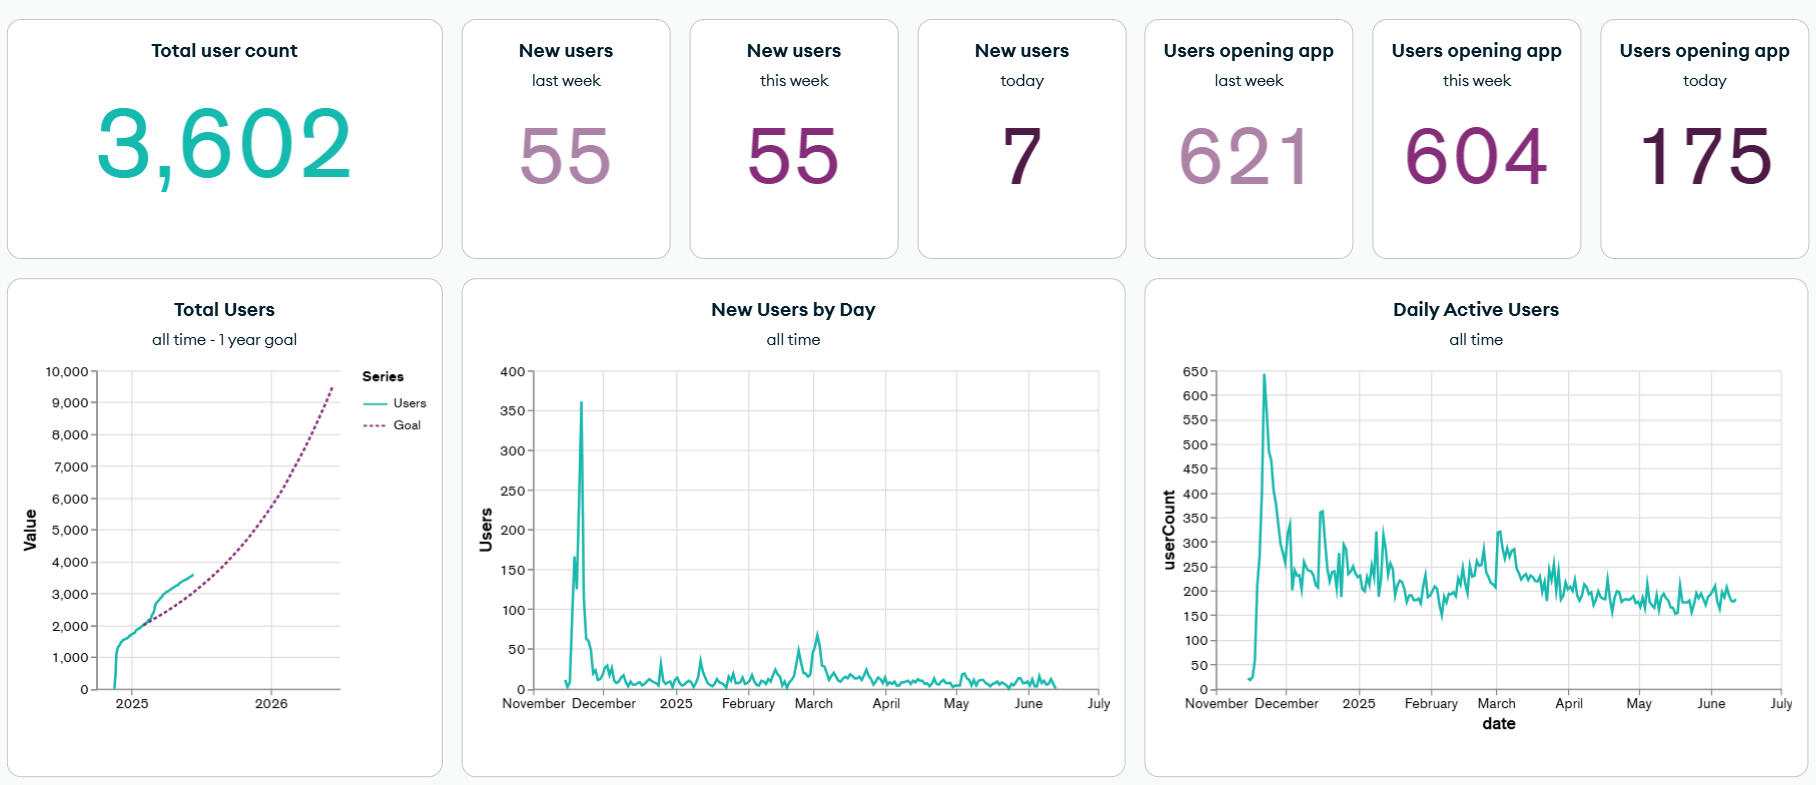
Impact Viz transformed Crossroads' MongoDB test user data into a live, interactive Google Sheets dashboard in time for launch. This gave the team real-time visibility into new sign-ups and app usage starting day one. It was clean, functional, and immediately helpful for spotting traction.As Crossroads gained users, the data outgrew Google Sheets. Rather than pivot to a costly analytics platform, we moved to MongoDB’s built-in data visualization tools. Though we were unfamiliar with the platform, we designed a sustainable dashboard that kept costs low – avoiding new software subscriptions that would chip away at the team’s limited resources – and aligned with the team’s actual data needs.
Data shared with permission
What the Dashboard Tracked
The initial version focused on launch-day KPIs:
• New user
• App openingsFrom there, we expanded the dashboard to support:
• Week-over-week trends
• Specific feature usage
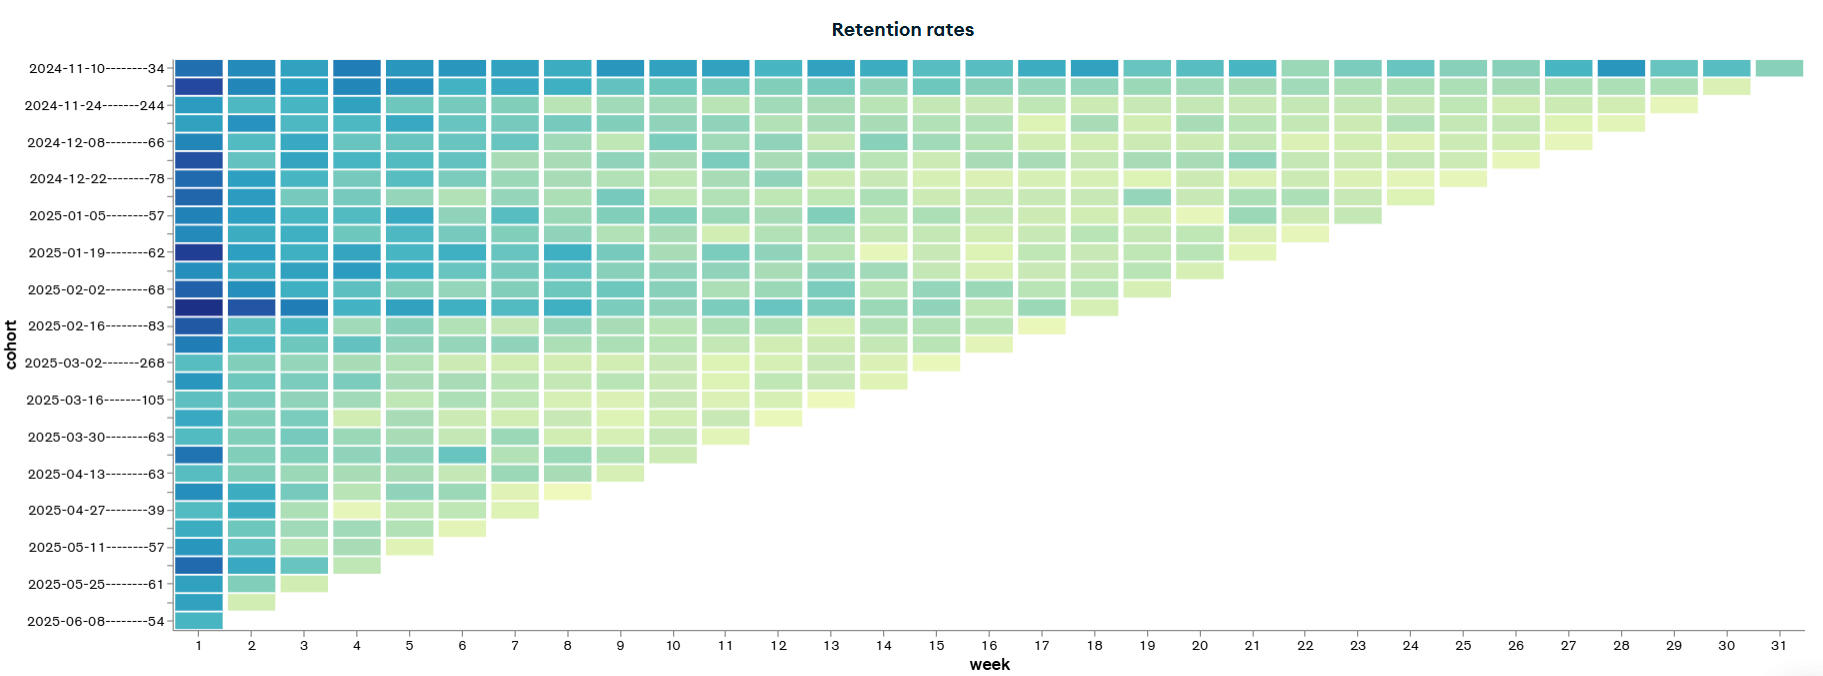
• Cohort retention analysis (Were people still opening the app a week or two after signing up?)
Data shared with permission
Designed for Everyone
We made the dashboard intuitive for the whole team – engineers, marketing, and the CEO – so that anyone could dive in and find what they needed. It matched Crossroads’ branding so screenshots could be used in investor materials, pitches, and presentations with no extra design work required. Most importantly, it answered all the growth top questions about how the app was performing.